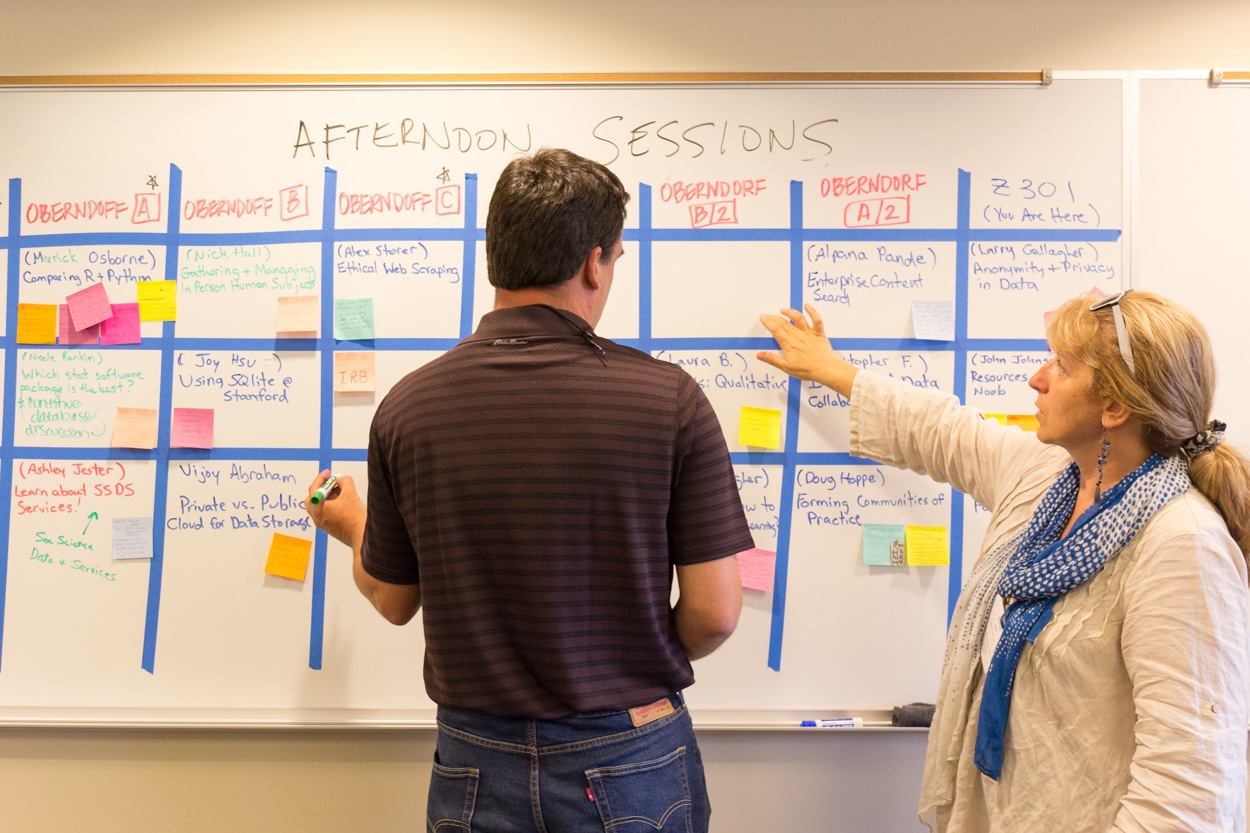
http://sdrr.stanford.edu/#sessions
Slides presented by Joy and Laissa
Tableau
A fast analytics tool, allowing non-IT business users to perform data discovery, develop insights, and create interactive visualizations for management decision making and performance monitoring.
- Drag and drop reporting
- Interactive dashboards with drill down capabilities
- Quick table calculations
- Geospatial intelligence
Tip: Avoid using Tableau to replicate tabular Excel reports.
Good to use Tableau to get a sense of data
Easy to use for non-programmers, “Show Me” feature recommends visualizations/views of data
Tableau Examples and Resources
Use Tableau Desktop App to create workbooks (to share would need to publish on a server)
Kimberly Shay Morton – Tableau Account Manager for Stanford (kimorton@tableau.com)
Stanford has a site license for Tableau server
Kumar Priyadarshi, Stanford Administrative Systems, Tableau Server Administrator (kumarp05@stanford.edu)
Info needed to set up Stanford Tableau Server account
Stanford Tableau User Group – subscribe to mailing list
Tableau Public Server
D3
D3 (or D3.js) is a JavaScript library for visualizing data using web standards
- Open Source
- Web standards – HTML SVG CSS
- Powerful visualization components
- Highly customizable
- Fast, support large datasets, dynamic behaviors for interaction and animation
- Lots of online resources and examples
D3 Examples & Demo
- Irina Zaks – showed Stanford Securities Litigation Analytics D3 and Drupal site
- Developed in response to Law School faculty requests for a platform for data research
- Drupal – CMS – made it easy for faculty to submit info (upload .csv), share and collaborate
- D3 – support for customized visualizations
